By Will Allchorn and Jocelyn Evans (University of Leeds)
The next 2018 local election looks very likely to record the completion of the full party life-cycle for the United Kingdom Independence Party (UKIP). For most of its history, UKIP was electorally irrelevant. Founded in 1993 as a way of converting Conservatives to hard Euroscepticism, its early attempts at electoral success were thwarted by infighting and a stronger Eurosceptic opponent (such as James Goldsmith’s Referendum Party). Briefly successful under the leadership of Robert Kilroy-Silk in 2004, it wasn’t until Nigel Farage, a former City banker and one of UKIP’s first MEPs, assumed the leadership for the second time in November 2010 that the party experienced a step-change in its electoral success, transforming UKIP from a single-issue movement into a party much closer to the populist radical right party type prevalent elsewhere in Europe, fusing anti-EU politics with socially conservative, anti-migrant, and anti-elitist messages.
Rising to its electoral zenith in the 2014 European Parliamentary elections, this momentum was sustained going into the 2015 General Election. This represented a marked change on 2005 and 2010, where the consistent support garnered in the previous year’s Euro-elections - 16.1% in 2004 and 16.5% in 2009, beating Labour into second place – dropped off considerably in the subsequent General Election, to 2.3% and 3.2% respectively. In 2005, a party still strongly associated with the European issue, self-evidently visible and valuable in a European poll, lost out in elections where the issue was of very low salience, and voters’ attention was partly distracted by Kilroy-Silk’s failed leadership coup. In 2010, the Conservative Party dampened Europe as a campaign issue, muffling UKIP’s electoral pitch. Even in the wake of the Parliamentary expenses scandal, UKIP’s ‘main’ gains derived not from their traditional Conservative competitor, but from a Labour Party which had lost credibility on both Europe and immigration.
2015 differed in the decision by Farage to focus on immigration as the core of their campaign, in a period when a Conservative Party which had been expected to be tough on immigration had instead presided over increased work-related migration from an economically unstable Eurozone, raising the issue’s saliency. Linked to an anti-establishment, populist rhetoric, the party contested 624 seats and attracted nearly 4 million of the votes cast – 12.9%. Inevitably, the electoral system ensured that, despite polling over 1 in 10 votes, this resulted in only a single seat, and that to a Tory defector, Douglas Carswell.[1]
Coming in the wake of the 2016 EU referendum, UKIP’s performance at the 2017 General Election, however, saw a new nadir for the insurgent outsider (see Table 1). After the collapse of its vote in the May 2017 local election, the General Election one month later saw its vote count reduced to just under 600,000, failing to challenge for any seats and allowing the left-of-centre Liberal Democrats to retake their unofficial place as the third party of British politics, despite themselves losing vote share on 2015.
Table 1: Votes and vote share of the major parties in the UK 2015 and 2017 General Elections
|
|
UK 2015 General Election | UK 2017 General Election | ||
| Party | Votes | Vote Share | Votes | Vote Share |
| Conservative Party | 11,334,226 | 36.9% | 13,669,883 | 42.2% |
| Labour Party | 7,678,491 | 30.4% | 10,638,475 | 40% |
| Liberal Democrats | 2,415,916 | 7.9% | 2,878,460 | 7.4% |
| UKIP | 3,881,099 | 12.6% | 594,068 | 1.9% |
| SNP | 1,454,436 | 4.7% | 977,569 | 3.1% |
| Green Party | 1,118,425 | 3.6% | 525,435 | 1.6% |
| Others | 2,814,932 | 3.9% | 2,916,927 | 3.8 % |
| Registered | 46,354,197 | 46,835,433 | ||
| Abstention | 15,656,672 | 14,518,984 | ||
| Voted | 30,779,187 | 32,316,449 | ||
| Rejected | 102,639 | 74,289 | ||
| Valid | 30,697,525 | 32,220,817 | ||
| Source: Electoral Commission | ||||
For a party moving away from the single-issue focus towards the populist radical right archetype common to other European nations, the cause of the party’s downfall was quintessentially single-issue – victory in the June 2016 referendum on EU membership deprived the party of its founding objective. Given the government’s evident commitment to pursuing Brexit – ‘Brexit means Brexit’, as Prime Minister Theresa May helpfully clarified – and UKIP’s own descent back into internecine score-settling after Farage’s departure, the vast majority of UKIP supporters preferred to back a Tory party now onside on the issue of Europe, as well as immigration. Using promises of a hard Brexit, grammar schools and a free vote on fox-hunting, May and the Conservatives were able to poach a large portion of the UKIP electorate – albeit while losing socially progressive Conservative voters to Labour. The individual data in the UK SCoRE survey suggest that about half (49%) of UKIP voters of 2015 moved to the Tories in 2017 (unweighted data based on self-reported votes in 2015 and 2017).[2]
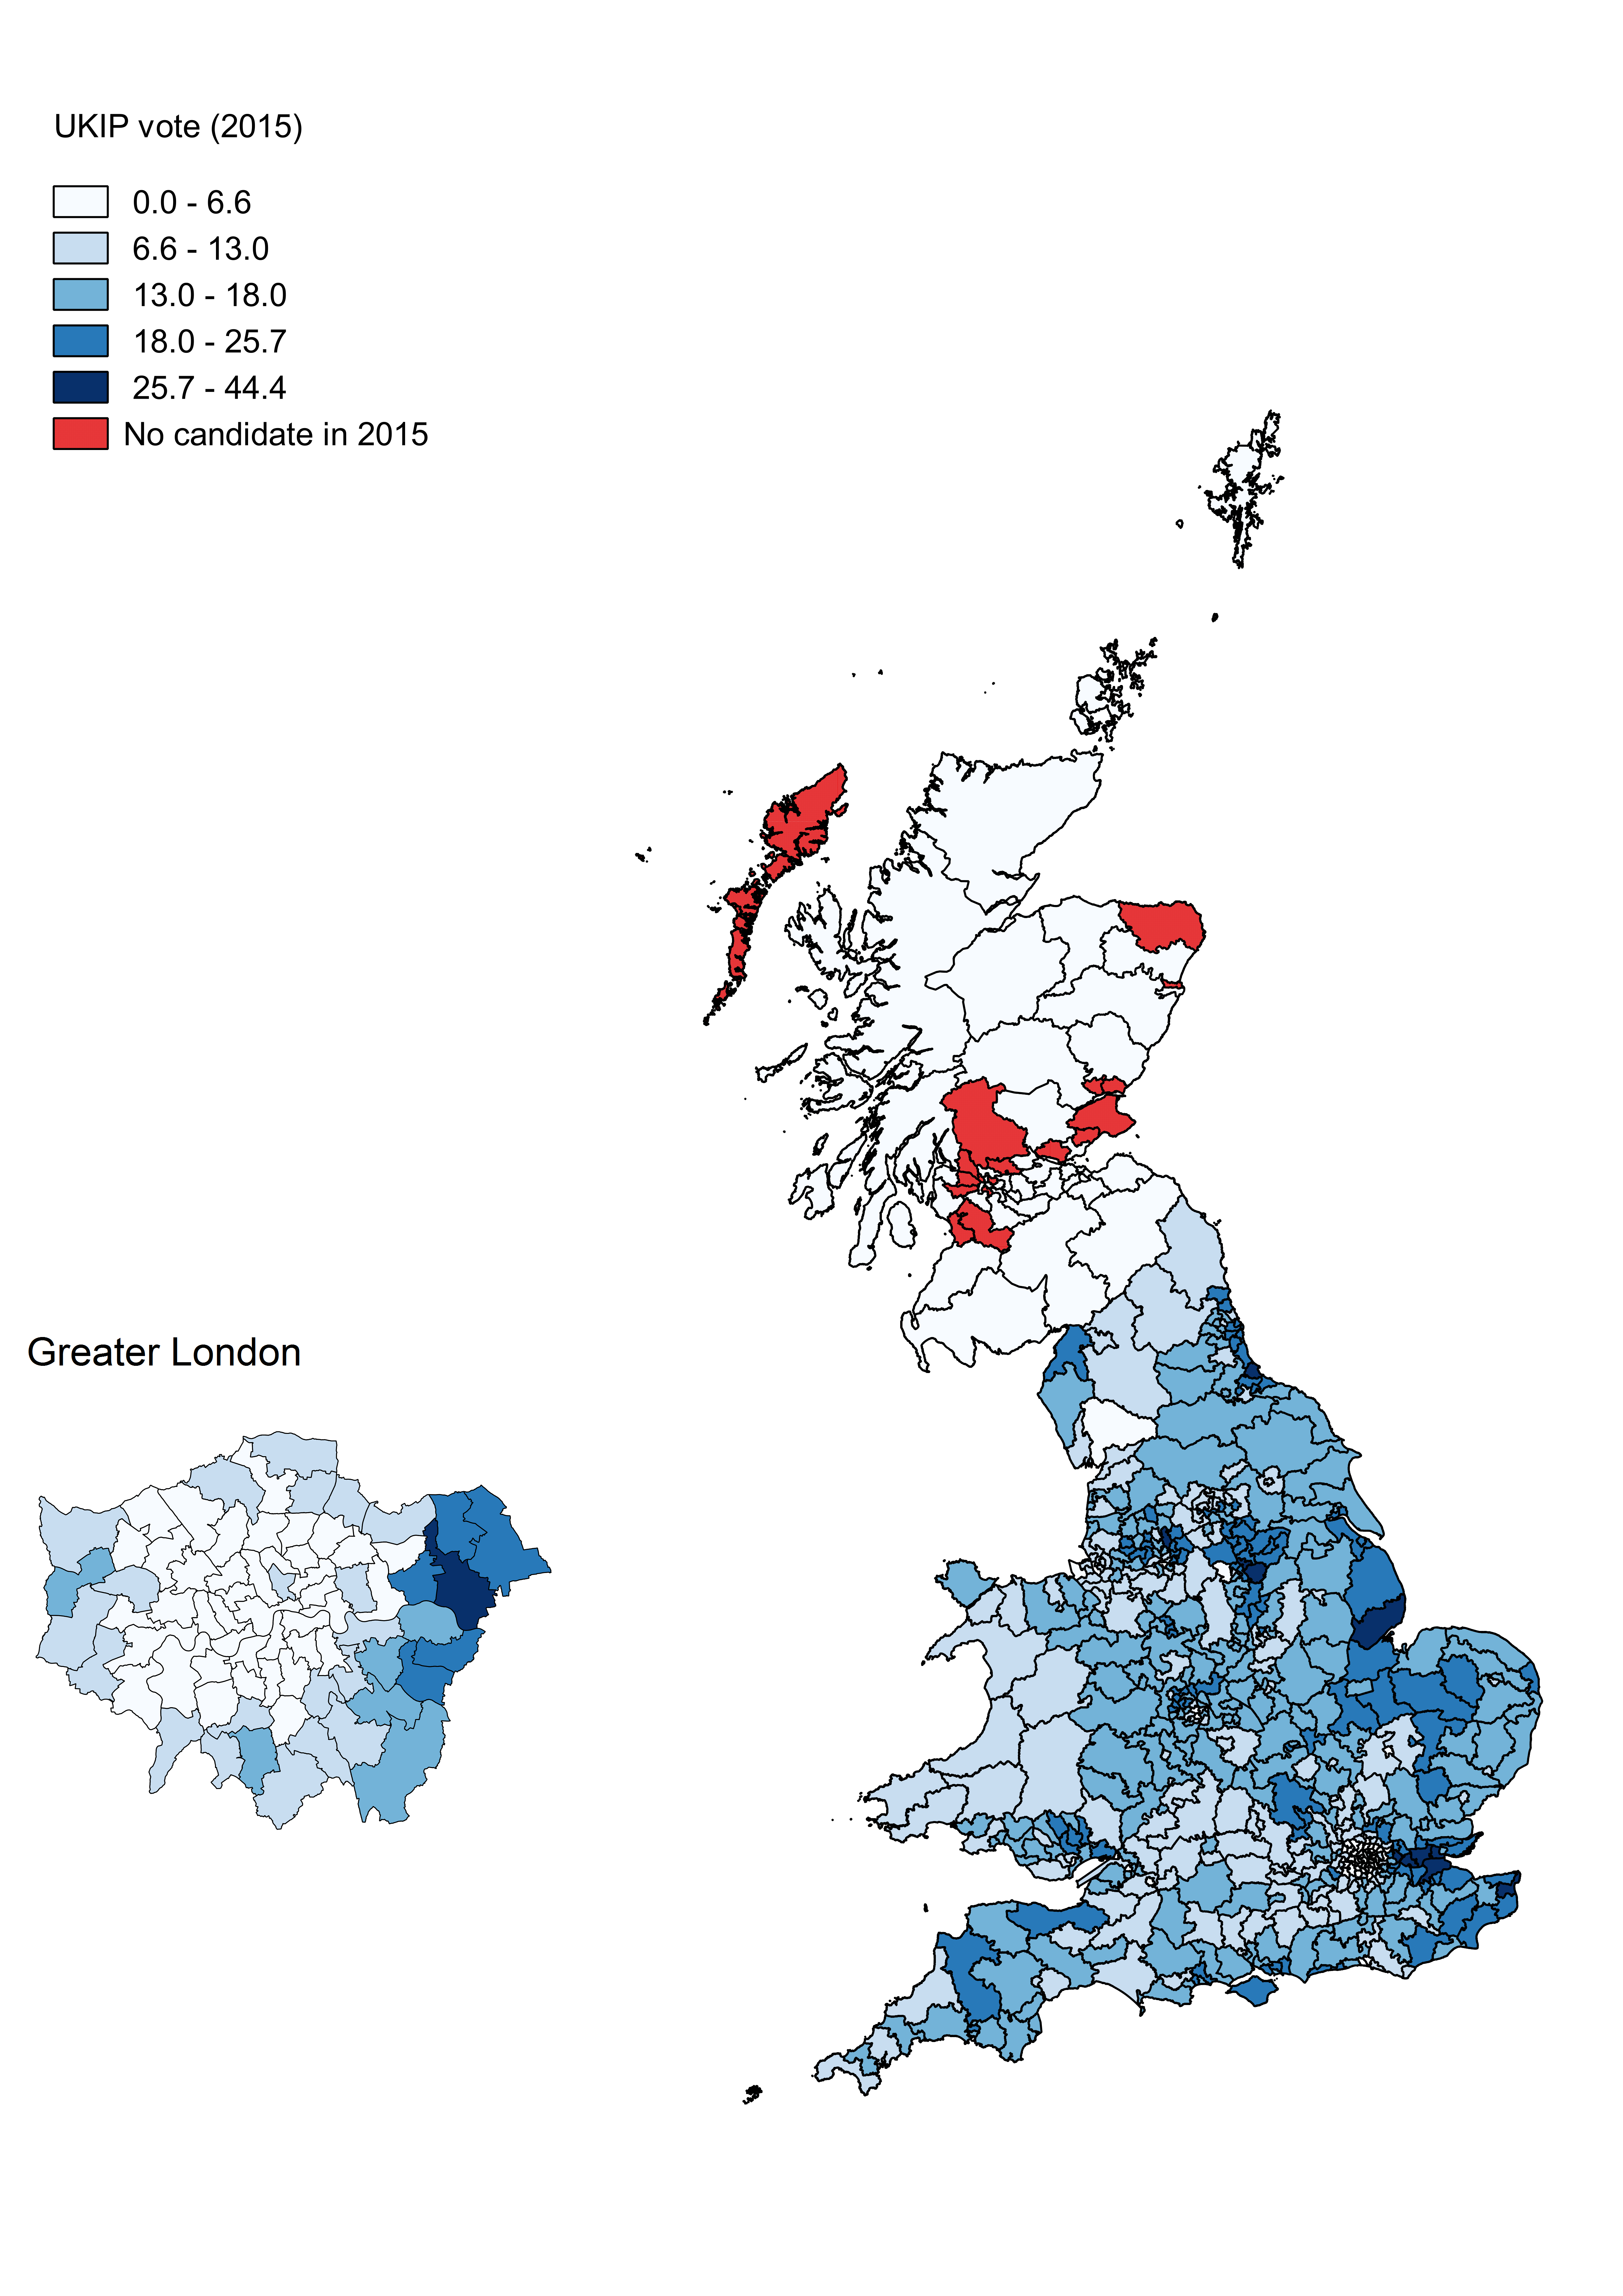
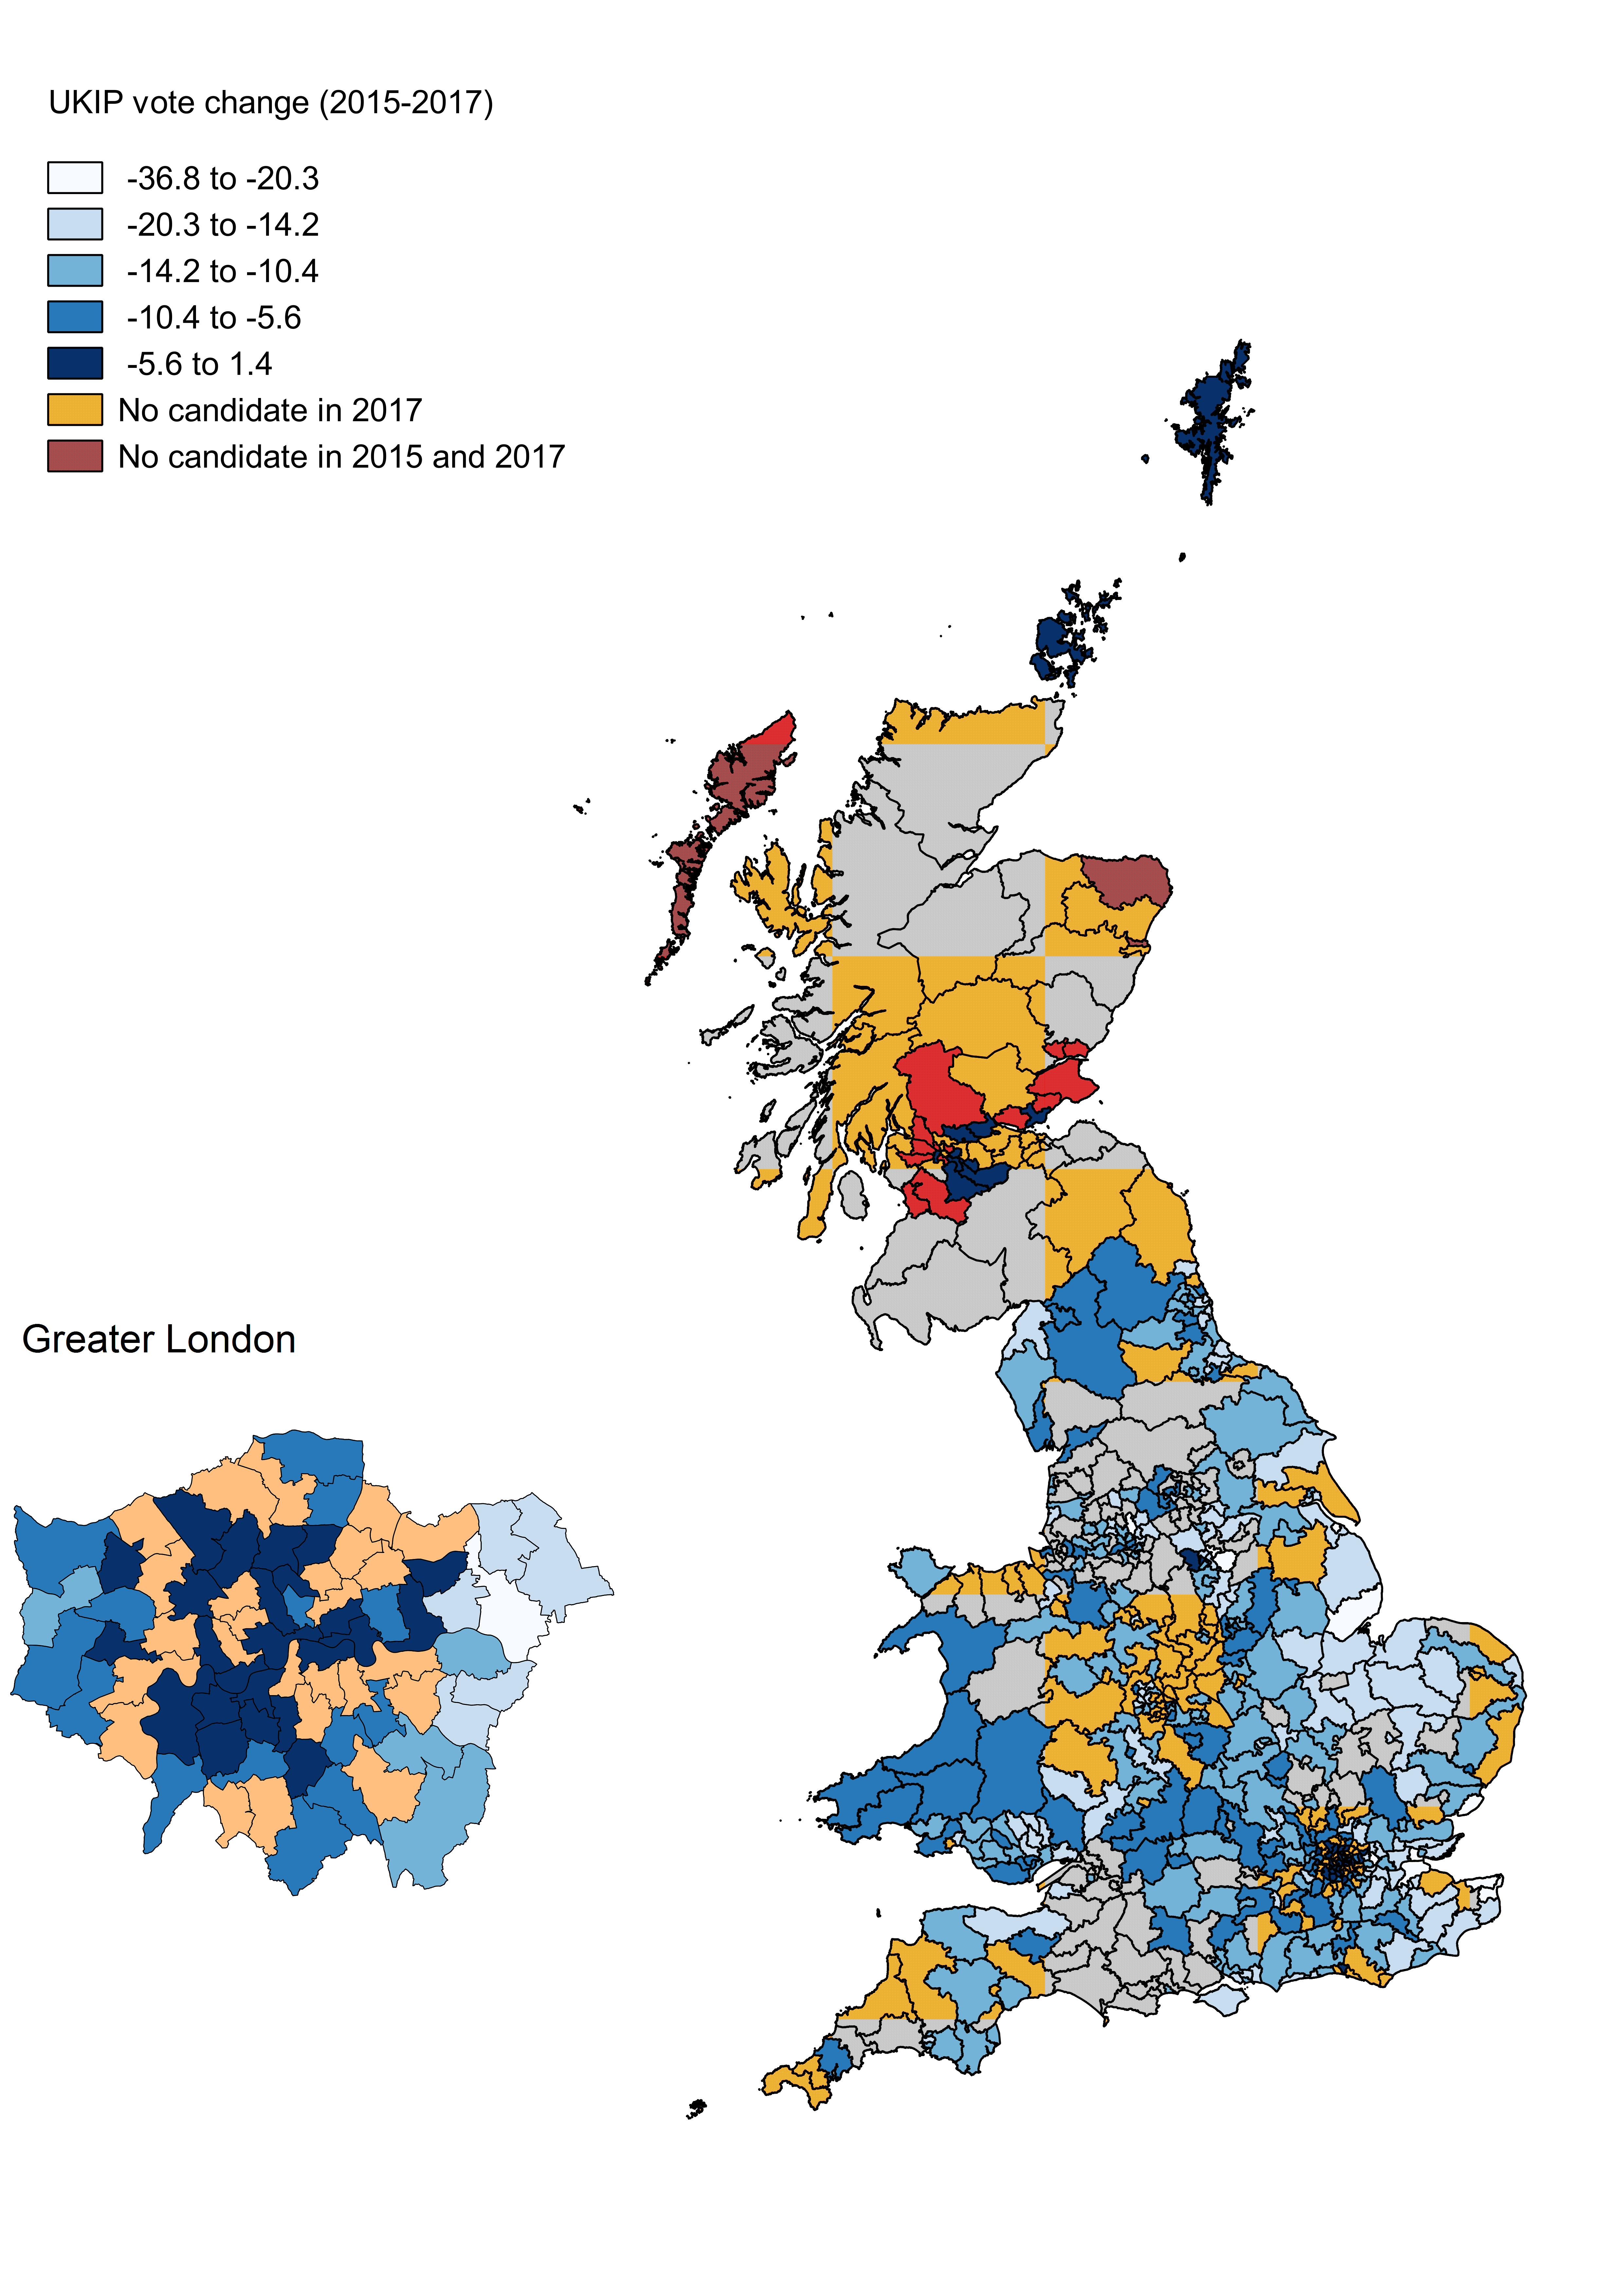
If we compare UKIP’s electoral performance between the 2015 and 2017 General Elections (see Figures 1 and 2), we can see the spatial dimension of their loss of support. With the party posting significantly fewer candidates than in 2015 – 377 in total – UKIP was running a far more peripheral campaign in 2017. The largest net losses are visible in some of its former strongholds in the East – Clacton, South Thanet, Boston and Skegness – as well as Midlands and South Yorkshire constituencies in, for example, Doncaster, Dudley, Rotherham and Mansfield where the party had won around a quarter of the vote in 2015. Lower losses in the inner London constituencies simply correspond to the much lower vote share enjoyed there even in 2015. Only Thurrock and Hartlepool managed double-digit vote shares – 20% and 11.5% respectively – and the only constituency to see a positive result was Cumbernauld, Kilsyth and Kirkintilloch East, where a UKIP candidate stood for the first time, albeit winning only 1.4%. An inter-quartile range of 9.7 in 2015, indicating a spread of winning and losing constituencies, drops to 2.2 in 2017 – little variation for the bulk of constituencies back to marginal party status.
The net loss of almost 85% of the party’s vote share begs the question why just under 600,000 voters voted for the party. Other analyses (e.g. James Dennison in Britain Votes 2017[3]) have examined the demographic and attitudinal congruity between the 2015 and 2017 electorates, as well as the UKIP loyalists’ dislike of Theresa May and the Tories, not deemed sufficiently anti-immigrant, and relative support for Paul Nuttall, the then UKIP leader. If we compare the UKIP loyalists with switchers alongside Tory and Labour loyalists, other interesting differentiators are present (Table 2). As a group, the switchers are more strongly anti-European suggesting a tactical preference for a governing party able to deliver Brexit. Conversely, there is no difference on immigration issues – loyalists and switchers score identically on this attitude. UKIP loyalists score more highly on populist measures such as opposing professional politicians, and interestingly, a higher predisposition towards the virtually defunct British National Party.[4] The loyal UKIP voters, then, have a profile closer to a populist Radical Right Party’s supporters in terms of anti-establishment views, but not on immigration, than those who have left, whose priority focuses on leaving the EU.
Table 2: Political attitudes by self-designated voter groups in 2015 and 2017 General Elections
| Voter group (2015 – 2017) | UKIP loyalists |
UKIP → Conservative switchers | Conservative loyalists | Labour loyalists | Other |
| I would rather be represented by a citizen than by a specialized politician (5-point scale – 1 = strongly disagree; 5 = strongly agree) | 4.1 | 3.6 | 3.1 | 3.7 | 3.6 |
| How probable is it that you will ever vote for the British National Party? (11-point scale – 0 = not at all probable; 10 = very probable) | 3.3 | 2.0 | 0.8 | 0.8 | 1.4 |
| Would you say that Britain’s cultural life is generally undermined or enriched by people coming to live here from other countries? (7-point scale – 1 = undermined; 7 = enriched) | 2.5 | 2.5 | 3.8 | 5.0 | 4.6 |
| Generally speaking, do you think that the UK's membership of the European Union has been a good or bad thing? (% responding ‘bad’) | 67% | 79% | 42% | 16% | 21% |
| N | 462 | 1041 | 5713 | 4804 | 12981 |
| Source: UK SCoRE survey | |||||
Of course, political parties have returned from heavy electoral defeats, though few as decisive as UKIP in 2017. However, the party’s loss of its third leader since the referendum in the wake of a racism scandal, its loss of party members, and of local candidates for the 2018 elections – down by some three-quarters – as well as near-bankruptcy after expensive legal costs from a defamation case, indicate an organisation in no position to effectuate a Phoenix-like resurrection, even if it possessed a relevant programmatic case for a post-Brexit UK. Nonetheless, its disappearance as a party would not mean the disappearance of socially conservative and ethnocentric positions in the electorate, the issues and attitudes represented by UKIP still finding their mouth-piece through sections of the Tory Party.
[1] The personal vote instrumental in Carswell’s election was clear when his UKIP successor in the Clacton constituency in the 2017 election experienced the largest loss in vote share of any of the party’s candidates.
[2] YouGov data report 45% of UKIP’s 2015 voters moving to the Conservatives (https://yougov.co.uk/news/2017/06/22/how-did-2015-voters-cast-their-ballot-2017-general/)
[3] James Dennison, ‘The Rug Pulled from Under Them: UKIP and the Greens’, Parliamentary Affairs, 71(1), 91-108 (available at https://academic.oup.com/pa/article/71/suppl_1/91/4930857).
[4] First-time voters for UKIP in 2017 reported an even higher proclivity towards a possible BNP vote, with a mean of 4.3.